Hazard: Tropical Cyclone Surge
note on use in different OS due to elevation package that are currently not solved automatically:
linux and macOS: if not working, try
conda install unzip==6.0
windows: error due to GNU make, unzip and gunzip dependencies. Working on a solution.
TCSurge class contains surges generated by tropical cyclones. Given a TropCyclone instance, it computes the surges for each historical and/or synthetic event at every centroid. TCSurge inherits from Hazard and has an associated hazard type TS.
The model
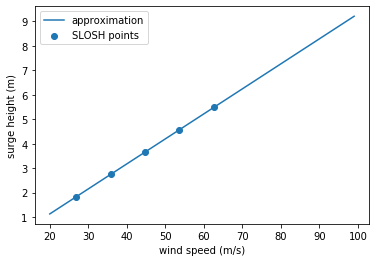
First the surge height is computed from the tropical cyclone’s gust field following an approximation to the SLOSH model as follows:
[1]:
%matplotlib inline
import numpy as np
import matplotlib.pyplot as plt

# conversion factors
mph2ms = 0.44704;
f2m = 0.3048;

# the points read from the SLOSH graph
v0 = 60*mph2ms;
v1 = 140*mph2ms;
s0 = 6*f2m;
s1 = 18*f2m;

# the parameters for the linear function: a*(v-v0)+s0
a = (s1-s0)/(v1-v0)

# graphical representation
v = np.arange(20, 100)
vmph = np.arange(60, 141, 20)

plt.plot(v, a*(v-v0)+s0, label='approximation')
plt.scatter(vmph*mph2ms, a*(vmph*mph2ms-v0)+s0, label='SLOSH points')
plt.xlabel('wind speed (m/s)')
plt.ylabel('surge height (m)')
plt.legend()
plt.show()
The elevation of the centroids is then substracted to the surge using a Digital Elevation Model of 30 m or 90 m resolution (SRTM1 and SRTM3 respectively using the python elevation package).
Finally, a decay of the surge height is implemented over flat land (up to 10 m elevation) until 50 km inland. We fix a decay factor of 0.2 meters per kilometer. All these parameters are configurable through the corresponding constants of the module climada.hazard.tc_surge. Currently these have been fixed in accordance to literature. See for example Brecht et al. 2012 [1].
[1] Brecht, H., Dasgupta, S., Laplante, B., Murray, S., Wheeler, D., 2012. Seal-level rise and storm surges: high stakes for a small number of developing countries. The Journal of Environment and Development 21, https://doi.org/10.1177/1070496511433601.
EXAMPLE
We compute the surges of Sidr 2007 and Roanu 2016 over Bangladesh as follows:
[2]:
%matplotlib inline
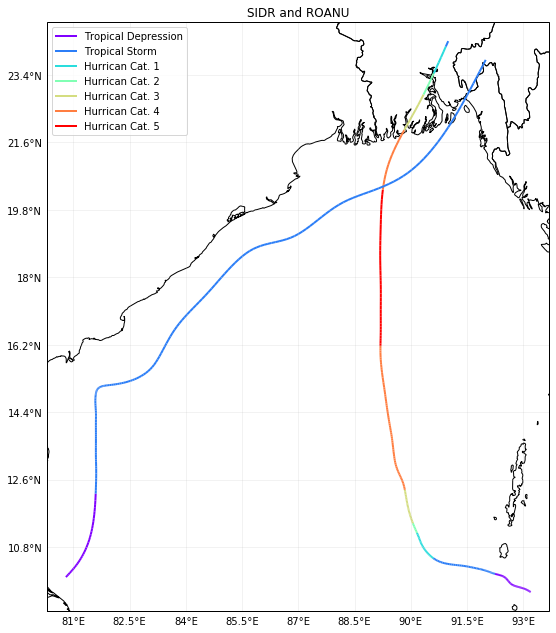
# 1: tracks retrieval
from climada.hazard import TCTracks
tr_usa = TCTracks()
tr_usa.read_ibtracs_netcdf(provider='usa', storm_id=['2007314N10093', '2016138N10081']) # SIDR 2007 and ROANU 2016
tr_usa.equal_timestep(0.5)
ax = tr_usa.plot()
ax.get_legend()._loc = 2 # correct legend location
ax.set_title('SIDR and ROANU'); # set title
2019-10-29 21:02:51,355 - climada - DEBUG - Loading default config file: /Users/aznarsig/Documents/Python/climada_python/climada/conf/defaults.conf
2019-10-29 21:03:02,015 - climada.hazard.tc_tracks - INFO - Reading 2007314N10093: SIDR
2019-10-29 21:03:02,162 - climada.hazard.tc_tracks - INFO - Reading 2016138N10081: ROANU
2019-10-29 21:03:02,302 - climada.hazard.tc_tracks - INFO - Interpolating 2 tracks to 0.5h time steps.
/Users/aznarsig/Documents/Python/climada_python/climada/util/plot.py:318: UserWarning: Tight layout not applied. The left and right margins cannot be made large enough to accommodate all axes decorations.
  fig.tight_layout()
[3]:
# 2: wind gusts computation
from climada.hazard import TropCyclone, Centroids

# define centroids raster
min_lat, max_lat, min_lon, max_lon = 20, 27, 88.5, 92.5
cent_bang = Centroids()
cent_bang.set_raster_from_pnt_bounds((min_lon, min_lat, max_lon, max_lat), res=0.015)
cent_bang.check()

tc_bang = TropCyclone()
tc_bang.set_from_tracks(tr_usa, centroids=cent_bang)
2019-10-29 21:03:03,948 - climada.hazard.centroids.centr - INFO - Setting geometry points.
2019-10-29 21:03:08,318 - climada.hazard.centroids.centr - DEBUG - Setting dist_coast 125424 points.
2019-10-29 21:03:25,247 - climada.hazard.trop_cyclone - INFO - Mapping 2 tracks to 125424 centroids.
2019-10-29 21:03:29,488 - climada.hazard.trop_cyclone - DEBUG - Append events.
2019-10-29 21:03:29,587 - climada.hazard.trop_cyclone - DEBUG - Compute frequency.
[4]:
# 3: surge computation
from climada.hazard import TCSurge

ts_bang = TCSurge()
ts_bang.set_from_winds(tc_bang, dem_product='SRTM3')
# The execution time the first time is long, since the DEM files are being downloaded by the elevation library
2019-10-29 21:03:29,597 - climada.hazard.centroids.centr - DEBUG - Setting elevation of raster with bounds (88.4925, 19.9875, 92.5125, 27.0075).
2019-10-29 21:04:06,980 - climada.hazard.tc_surge - INFO - Restricting to centroids in elevation range ]0..10] m and closer than 50 km to coast with a decay of 0.2 m/km inland.
[5]:
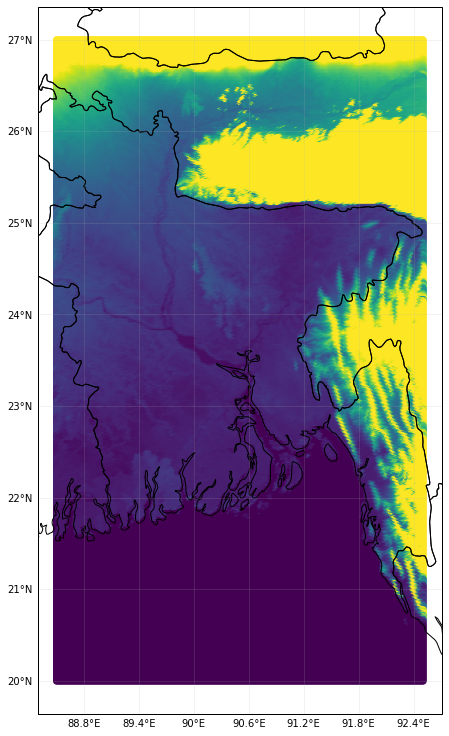
# plot elevation of the raster
ts_bang.centroids.plot(c=ts_bang.centroids.elevation, vmin=-3, vmax=100)
[5]:
<cartopy.mpl.geoaxes.GeoAxesSubplot at 0x1c2c92e240>
[6]:
# plot wind and surge SIDR
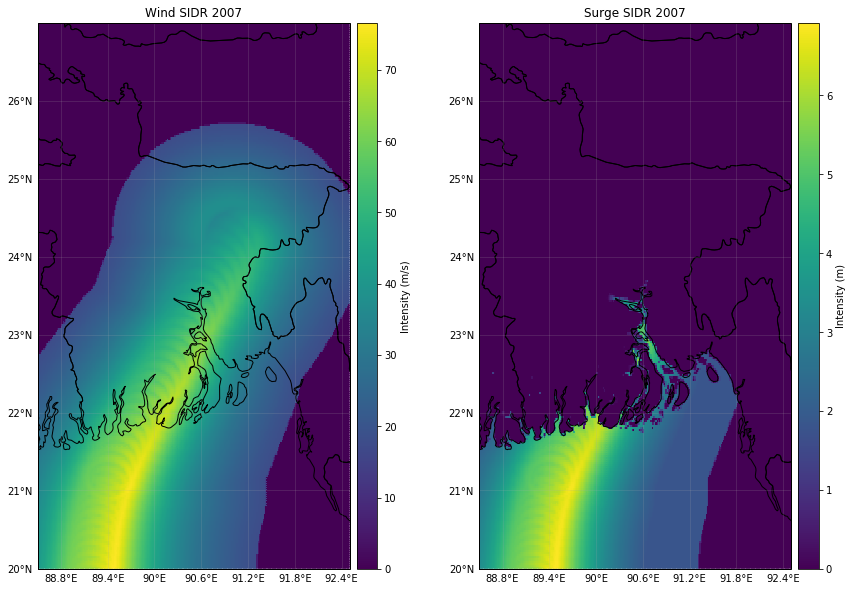
from climada.util.plot import make_map
fig, ax = make_map(2, figsize=(14, 14))
tc_bang.plot_intensity(1, axis=ax[0])
ts_bang.plot_intensity(1, axis=ax[1])
ax[0].set_title('Wind SIDR 2007')
ax[1].set_title('Surge SIDR 2007')
[6]:
Text(0.5, 1, 'Surge SIDR 2007')
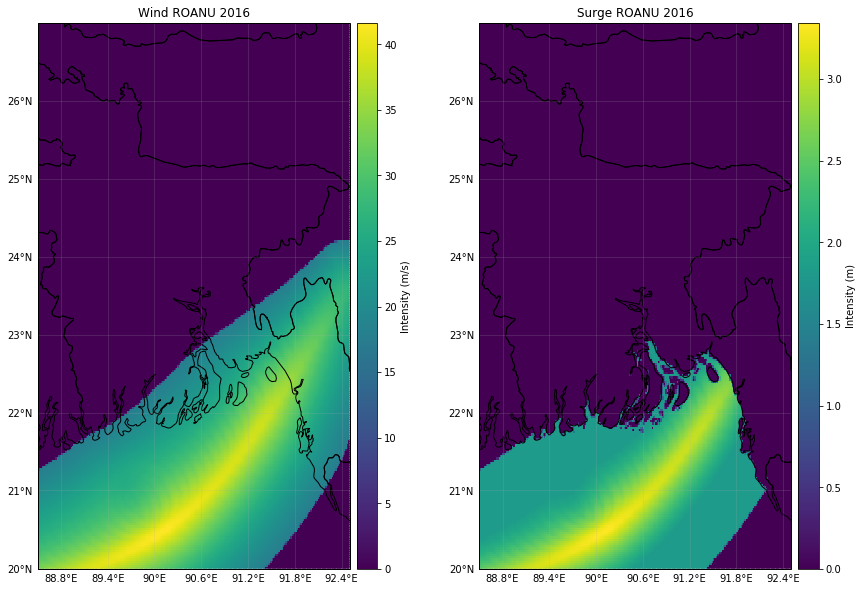
[7]:
# plot wind and surge ROANU
from climada.util.plot import make_map

fig, ax = make_map(2, figsize=(14, 14))
tc_bang.plot_intensity(2, axis=ax[0])
ts_bang.plot_intensity(2, axis=ax[1])
ax[0].set_title('Wind ROANU 2016')
ax[1].set_title('Surge ROANU 2016')
[7]:
Text(0.5, 1, 'Surge ROANU 2016')