Impact Functions#
What is an impact function?#
An impact function relates the percentage of damage in the exposure to the hazard intensity, also commonly referred to as a “vulnerability curve” in the modelling community. Every hazard and exposure types are characterized by an impact function.
What is the difference between ImpactFunc and ImpactFuncSet?#
An ImpactFunc is a class for a single impact function. E.g. a function that relates the percentage of damage of a reinforced concrete building (exposure) to the wind speed of a tropical cyclone (hazard intensity).
An ImpactFuncSet class is a container that contains multiple ImpactFunc. For instance, there are 100 ImpactFunc represent 100 types of buildings exposed to tropical cyclone’s wind damage. These 100 ImpactFunc are all gathered in an ImpactFuncSet.
What does an ImpactFunc look like in CLIMADA?#
The ImpactFunc class requires users to define the following attributes.
Mandatory attributes |
Data Type |
Description |
|---|---|---|
haz_type |
(str) |
Hazard type acronym (e.g. ‘TC’) |
id |
(int or str) |
Unique id of the impact function. Exposures of the same type will refer to the same impact function id |
name |
(str) |
Name of the impact function |
intensity |
(np.array) |
Intensity values |
intensity_unit |
(str) |
Unit of the intensity |
mdd |
(np.array) |
Mean damage (impact) degree for each intensity (numbers in [0,1]) |
paa |
(np.array) |
Percentage of affected assets (exposures) for each intensity (numbers in [0,1]) |
Users may use ImpactFunc.check() to check that the attributes have been set correctly. The mean damage ratio mdr (mdr=mdd*paa) is calculated by the method ImpactFunc.calc_mdr().
What does an ImpactFuncSet look like in CLIMADA?#
The ImpactFuncSet class contains all the ImpactFunc classes. Users are not required to define any attributes in ImpactFuncSet.
To add an ImpactFunc into an ImpactFuncSet, simply use the method ImpactFuncSet.append(ImpactFunc). If the users only has one impact function, they should generate an ImpactFuncSet that contains one impact function. ImpactFuncSet is to be used in the impact calculation.
Attributes |
Data Type |
Description |
|---|---|---|
_data |
(dict) |
Contains |
Part 1: Defining ImpactFunc from your own data#
The essential attributes are listed in the table above. The following example shows you how to define an ImpactFunc from scratch, and using the method ImpactFunc.calc_mdr() to calculate the mean damage ratio.
Generate a dummy impact function from scratch.#
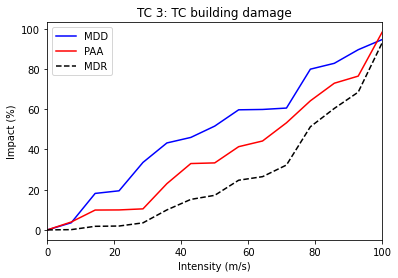
Here we generate an impact function with random dummy data for illustrative reasons. Assuming this impact function is a function that relates building damage to tropical cyclone (TC) wind, with an arbitrary id 3.
import numpy as np
from climada.entity import ImpactFunc

# We initialise a dummy ImpactFunc for tropical cyclone wind damage to building.
# Giving the ImpactFunc an arbitrary id 3.
haz_type = "TC"
id = 3
name = "TC building damage"
# provide unit of the hazard intensity
intensity_unit = "m/s"
# provide values for the hazard intensity, mdd, and paa
intensity = np.linspace(0, 100, num=15)
mdd = np.concatenate((np.array([0]), np.sort(np.random.rand(14))), axis=0)
paa = np.concatenate((np.array([0]), np.sort(np.random.rand(14))), axis=0)
imp_fun = ImpactFunc(
    id=id,
    name=name,
    intensity_unit=intensity_unit,
    haz_type=haz_type,
    intensity=intensity,
    mdd=mdd,
    paa=paa,
)

# check if the all the attributes are set correctly
imp_fun.check()
# Calculate the mdr at hazard intensity 18.7 m/s
print("Mean damage ratio at intensity 18.7 m/s: ", imp_fun.calc_mdr(18.7))
Mean damage ratio at intensity 18.7 m/s: 0.01878041941423081
Visualise the Impact function#
The method plot() uses the matplotlib’s axes plot function to visualise the impact function. It returns a figure and axes, which can be modified by users.
# plot impact function
imp_fun.plot();
Part 2: Loading impact functions from CLIMADA in-built impact functions#
In CLIMADA there is several defined impact functions that users can directly load and use them. However, users should be aware of the applications of the impact functions to types of assets, reading the background references of the impact functions are strongly recommended.
Currently available perils include
tropical cyclones,
river floods,
European windstorm,
crop yield, and
drought.Continuous updates of perils are available.
Here we use the impact function of tropical cyclones as an example.
Loading CLIMADA in-built impact function for tropical cyclones#
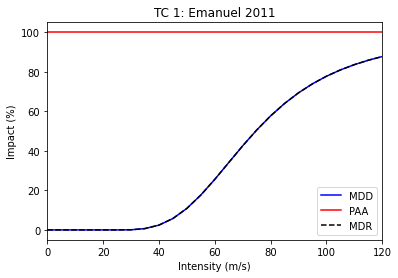
ImpfTropCyclone is a derivated class of ImpactFunc. This in-built impact function estimates the insured property damages by tropical cyclone wind in USA, following the reference paper Emanuel (2011).
To generate this impact function, method set_emanual_usa() is used.
from climada.entity import ImpfTropCyclone

# Here we generate the impact function for TC damage using the formula of Emanuel 2011
impFunc_emanuel_usa = ImpfTropCyclone.from_emanuel_usa()
# plot the impact function
impFunc_emanuel_usa.plot();
Part 3: Add ImpactFunc into the container ImpactFuncSet#
ImpactFuncSet is a container of multiple ImpactFunc, it is part of the arguments in ImpactCalc.impact() (see the impact tutorial).
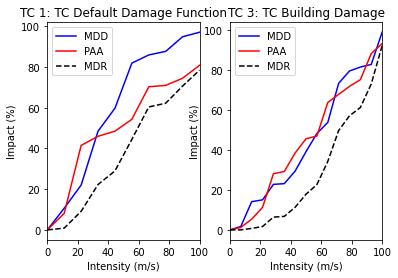
Here we generate 2 arbitrary impact functions and add them into an ImpactFuncSet class. To add them into the container, simply use the method ImpactFuncSet.append(ImpactFunc).
import numpy as np
import matplotlib.pyplot as plt
from climada.entity import ImpactFunc, ImpactFuncSet

# generate the 1st arbitrary impact function
haz_type = "TC"
id = 1
name = "TC Default Damage Function"
intensity_unit = "m/s"
intensity = np.linspace(0, 100, num=10)
mdd = np.concatenate((np.array([0]), np.sort(np.random.rand(9))), axis=0)
paa = np.concatenate((np.array([0]), np.sort(np.random.rand(9))), axis=0)
imp_fun_1 = ImpactFunc(
    id=id,
    name=name,
    intensity_unit=intensity_unit,
    haz_type=haz_type,
    intensity=intensity,
    mdd=mdd,
    paa=paa,
)
imp_fun_1.check()

# generate the 2nd arbitrary impact function
haz_type = "TC"
id = 3
name = "TC Building Damage"
intensity_unit = "m/s"
intensity = np.linspace(0, 100, num=15)
mdd = np.concatenate((np.array([0]), np.sort(np.random.rand(14))), axis=0)
paa = np.concatenate((np.array([0]), np.sort(np.random.rand(14))), axis=0)
imp_fun_3 = ImpactFunc(
    id=id,
    name=name,
    intensity_unit=intensity_unit,
    haz_type=haz_type,
    intensity=intensity,
    mdd=mdd,
    paa=paa,
)
imp_fun_3.check()

# add the 2 impact functions into ImpactFuncSet
imp_fun_set = ImpactFuncSet([imp_fun_1, imp_fun_3])
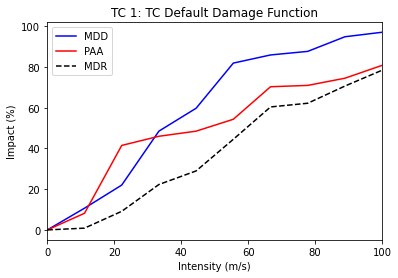
Plotting all the impact functions in an ImpactFuncSet#
The method plot() in ImpactFuncSet also uses the the matplotlib’s axes plot function to visualise the impact functions, returning a figure with all the subplots of impact functions. Users may modify these plots.
# plotting all the impact functions in impf_set
axes = imp_fun_set.plot()
Retrieving an impact function from the ImpactFuncSet#
User may want to retrive a particular impact function from ImpactFuncSet. Using the method get_func(haz_type, id), it returns an ImpactFunc class of the desired impact function. Below is an example of extracting the TC impact function with id 1, and using plot() to visualise the function.
# extract the TC impact function with id 1
impf_tc_1 = imp_fun_set.get_func("TC", 1)
# plot the impact function
impf_tc_1.plot();
Removing an impact function from the ImpactFuncSet#
If there is an unwanted impact function from the ImpactFuncSet, we may remove it using the method remove_func(haz_type, id) to remove it from the set.
For example, in the previous generated impact function set imp_fun_set contains an unwanted TC impact function with id 3, we might thus would like to remove that from the set.
# first plotting all the impact functions in the impact function set to see what is in there:
imp_fun_set.plot();
# removing the TC impact function with id 3
imp_fun_set.remove_func("TC", 3)
# plot all the remaining impact functions in imp_fun_set
imp_fun_set.plot();
Part 4: Read and write ImpactFuncSet into Excel sheets#
Users may load impact functions to an ImpactFuncSet class from an excel sheet, or to write the ImpactFuncSet into an excel sheet. This section will give an example of how to do it.
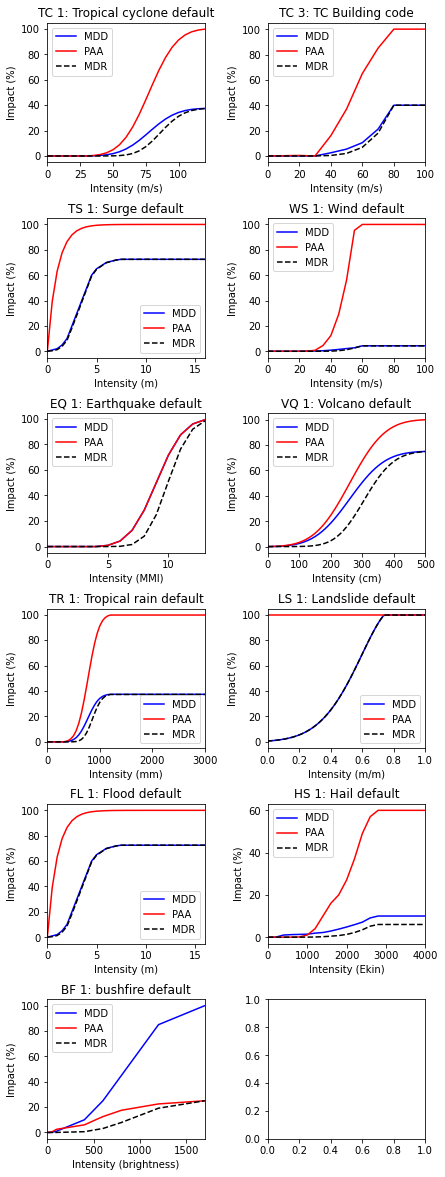
Reading impact functions from an Excel file#
Impact functions defined in an excel file following the template provided in sheet impact_functions of climada_python/climada/data/system/entity_template.xlsx can be ingested directly using the method from_excel().
from climada.entity import ImpactFuncSet
from climada.util import ENT_TEMPLATE_XLS
import matplotlib.pyplot as plt

# provide absolute path of the input excel file
file_name = ENT_TEMPLATE_XLS
# fill ImpactFuncSet from Excel file
imp_set_xlsx = ImpactFuncSet.from_excel(file_name)

# plot all the impact functions from the ImpactFuncSet
imp_set_xlsx.plot()
# adjust the plots
plt.subplots_adjust(right=1.0, top=4.0, hspace=0.4, wspace=0.4)
Write impact functions#
Users may write the impact functions in Excel format using write_excel() method.
# write imp_set_xlsx into an excel file
imp_set_xlsx.write_excel("tutorial_impf_set.xlsx")
Alternative saving format#
Alternatively, users may also save the impact functions into pickle format, using CLIMADA in-built function save(). Note that pickle has a transient format and should be avoided when possible.
from climada.util.save import save

# this generates a results folder in the current path and stores the output there
save("tutorial_impf_set.p", imp_set_xlsx)
2022-03-28 20:08:56,846 - climada.util.save - INFO - Written file /mnt/c/users/yyljy/documents/climada_main/doc/tutorial/results/tutorial_impf_set.p
Part 5: Loading ImpactFuncSet from CLIMADA in-built impact functions#
Similar to Part 3, some of the impact functions are available as ImpactFuncSet classes. Users may load them from the CLIMADA modules.
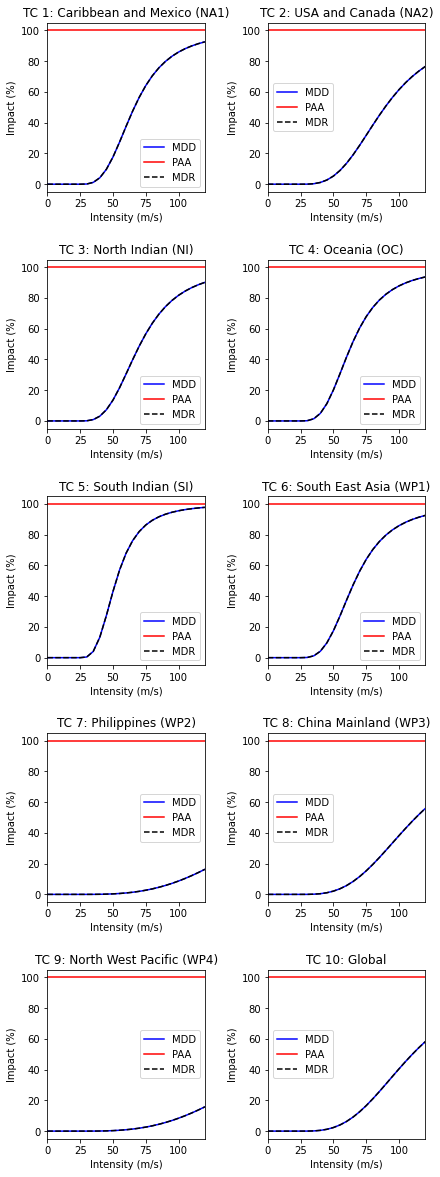
Here we use the example of the calibrated impact functions of TC wind damages per region to property damages, following the reference Eberenz et al. (2021). Method from_calibrated_regional_ImpfSet() returns a set of default calibrated impact functions for TC for different regions.
from climada.entity.impact_funcs.trop_cyclone import ImpfSetTropCyclone
import matplotlib.pyplot as plt

# generate the default calibrated TC impact functions for different regions
imp_fun_set_TC = ImpfSetTropCyclone.from_calibrated_regional_ImpfSet()

# plot all the impact functions
imp_fun_set_TC.plot()
# adjust the plots
plt.subplots_adjust(right=1.0, top=4.0, hspace=0.4, wspace=0.4)
/tmp/ipykernel_1009/2983082256.py:10: UserWarning: Tight layout not applied. tight_layout cannot make axes height small enough to accommodate all axes decorations.
  plt.tight_layout()